Some tools, links and snippets for debugging software on (Arch) Linux
On Arch Linux, we get “unlimited” core dumps. They are stored in the /var/lib/systemd/coredump directory.
kmille@linbox:~ ulimit -c
unlimited
kmille@linbox:~ cat /proc/sys/kernel/core_pattern
|/usr/lib/systemd/systemd-coredump %P %u %g %s %t %c %h
kmille@linbox:~ file /var/lib/systemd/coredump/* | head -n 1
/var/lib/systemd/coredump/core.a\x2eout.1000.cb780d16ec3e434aaaa6a69c01e0abe8.1270928.1611849944000000.zst:      Zstandard compressed data (v0.8+), Dictionary ID: None
List the core dumps.
kmille@linbox:~ coredumpctl list

TIME                            PID   UID   GID SIG COREFILE  EXE
...
Wed 2021-01-27 15:02:03 CET  489025  1000   100  11 present   /usr/bin/urxvt
Wed 2021-01-27 15:19:08 CET  491085  1000   100  11 present   /usr/bin/urxvt
Wed 2021-01-27 15:20:53 CET  434557  1000   100  11 present   /usr/bin/urxvt
Wed 2021-01-27 16:39:27 CET  492570  1000   100  11 present   /usr/bin/urxvt
Wed 2021-01-27 18:50:17 CET  495418  1000   100  11 present   /usr/bin/urxvt
Wed 2021-01-27 18:51:12 CET  499149  1000   100  11 present   /usr/bin/urxvt
Dump the core file the current working directory.
kmille@linbox:~ coredumpctl dump 499149 --output 499149.core
PID: 499149 (urxvt)
UID: 1000 (kmille)
GID: 100 (users)
Signal: 11 (SEGV)
Timestamp: Wed 2021-01-27 18:51:12 CET (7min ago)
Command Line: urxvt
Executable: /usr/bin/urxvt
Control Group: /user.slice/user-1000.slice/session-1.scope
Unit: session-1.scope
Slice: user-1000.slice
Session: 1
Owner UID: 1000 (kmille)
Boot ID: cb780d16ec3e434aaaa6a69c01e0abe8
Machine ID: 2ea1cb1e148d4172ad4915fa6e5d48c9
Hostname: linbox
Storage: /var/lib/systemd/coredump/core.urxvt.1000.cb780d16ec3e434aaaa6a69c01e0abe8.499149.1611769872000000.zst
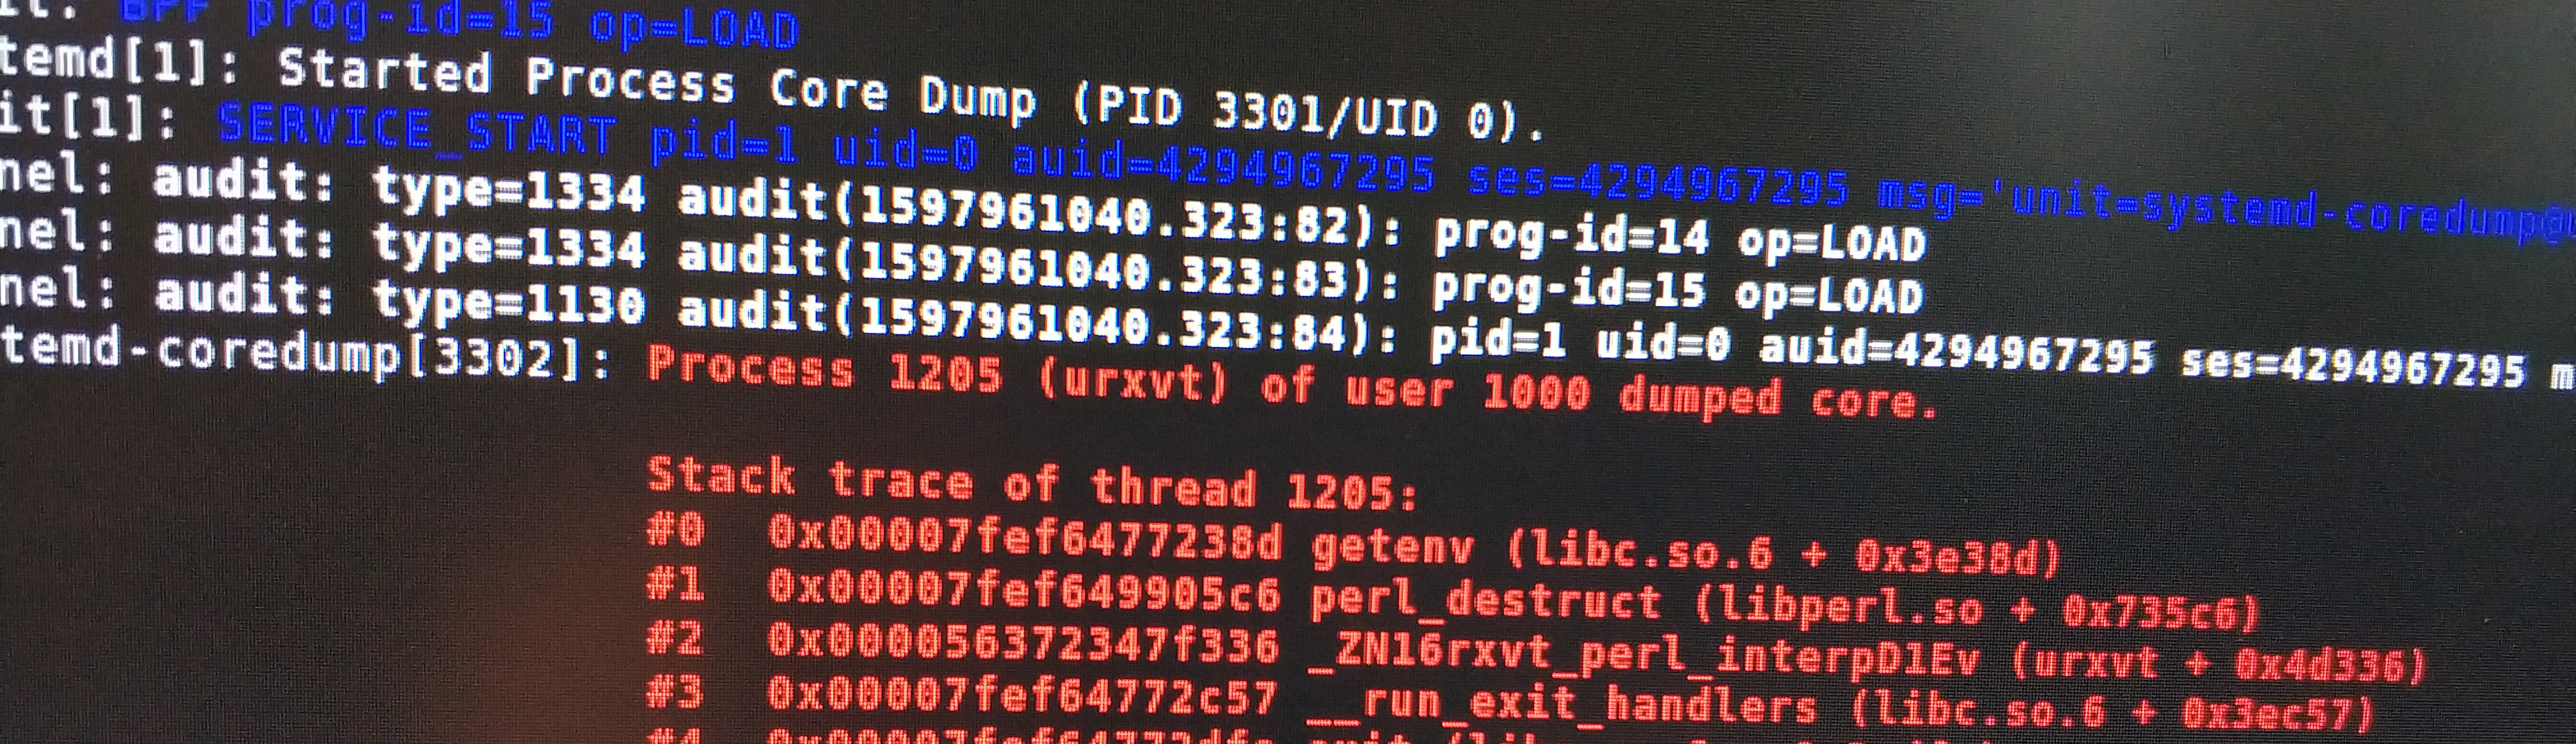
Message: Process 499149 (urxvt) of user 1000 dumped core.
Stack trace of thread 499149:
#0 0x00007f25969b34ed getenv (libc.so.6 + 0x3f4ed)
#1 0x00007f2596bd25c6 perl_destruct (libperl.so + 0x735c6)
#2 0x0000555f62069336 _ZN16rxvt_perl_interpD1Ev (urxvt + 0x4d336)
#3 0x00007f25969b3db7 __run_exit_handlers (libc.so.6 + 0x3fdb7)
#4 0x00007f25969b3f5e exit (libc.so.6 + 0x3ff5e)
#5 0x00007f259699c159 __libc_start_main (libc.so.6 + 0x28159)
#6 0x0000555f6204acfe _start (urxvt + 0x2ecfe)
kmille@linbox: file 499149.core
499149.core: ELF 64-bit LSB core file, x86-64, version 1 (SYSV), SVR4-style, from 'urxvt', real uid: 1000, effective uid: 1000, real gid: 100, effective gid: 100, execfn: '/usr/bin/urxvt', platform: 'x86_64'
Load urxvt with the core dump into gdb.
kmille@linbox: gdb -c 499149.core $(which urxvt)
...
Reading symbols from /usr/bin/urxvt...
(No debugging symbols found in /usr/bin/urxvt)
[New LWP 499149]
[Thread debugging using libthread_db enabled]
Using host libthread_db library "/usr/lib/libthread_db.so.1".
Core was generated by `urxvt'.
Program terminated with signal SIGSEGV, Segmentation fault.
#0  0x00007f25969b34ed in getenv () from /usr/lib/libc.so.6
(gdb) bt
#0  0x00007f25969b34ed in getenv () from /usr/lib/libc.so.6
#1  0x00007f2596bd25c6 in perl_destruct () from /usr/lib/perl5/5.32/core_perl/CORE/libperl.so
#2  0x0000555f62069336 in rxvt_perl_interp::~rxvt_perl_interp() ()
#3  0x00007f25969b3db7 in __run_exit_handlers () from /usr/lib/libc.so.6
#4  0x00007f25969b3f5e in exit () from /usr/lib/libc.so.6
#5  0x00007f259699c159 in __libc_start_main () from /usr/lib/libc.so.6
#6  0x0000555f6204acfe in _start ()
(gdb)
At this point we don’t have more information than in the output of coredumpctl dump 499149. We still don’t know which line in urxvt caused the segmentation fault. The problem is that gdb does not find the symbols (No debugging symbols found in /usr/bin/urxvt).
Some ways to find out if a binary contains debug symbols.
kmille@linbox:linux-debugging objdump --syms $(which urxvt)

/usr/bin/urxvt:     file format elf64-x86-64

SYMBOL TABLE:
no symbols

kmille@linbox:linux-debugging: readelf --debug-dump=decodedline $(which urxvt)
kmille@linbox:linux-debugging:
Let’s build urxvt by our own and add debug symbols. I use the Arch Build System client asp.
kmille@linbox:tmp asp checkout rxvt-unicode
Cloning into 'rxvt-unicode'...
done.
kmille@linbox:tmp cd rxvt-unicode
kmille@linbox:rxvt-unicode cd repos/community-x86_64
kmille@linbox:community-x86_64 vim PKGBUILD # add options=(debug !strip)
kmille@linbox:community-x86_64 makepkg -i # this will build and install the package
kmille@linbox:community-x86_64 makepkg -ef # if you edit the source and want to rebuild:
# use -e to use the local source code and skip the prepare() function
Now our gdb shows us the line in which the error occurs (./rxvtperl.xs:379).
(gdb) bt
#0  0x00007ffff774d4ed in getenv () from /usr/lib/libc.so.6
#1  0x00007ffff796c5c6 in perl_destruct () from /usr/lib/perl5/5.32/core_perl/CORE/libperl.so
#2  0x00005555555a1336 in rxvt_perl_interp::~rxvt_perl_interp (this=<optimized out>, __in_chrg=<optimized out>) at ./rxvtperl.xs:379
#3  0x00007ffff774ddb7 in __run_exit_handlers () from /usr/lib/libc.so.6
#4  0x00007ffff774df5e in exit () from /usr/lib/libc.so.6
#5  0x00007ffff7736159 in __libc_start_main () from /usr/lib/libc.so.6
#6  0x0000555555582cfe in _start ()
(gdb)
I use auto-load safe-path / in my global ~/.gdbinit. It allows me to use .gdbinit of the current working directory.
kmille@linbox: cat ~/.gdbinit
set auto-load safe-path /
The segfault happens if getenv is called. Let’s use man 3 getenv to get the parameters of it.
char *getenv(const char *name);
We can use man syscall to find out where the arguments are stored. We are interested in the first (and only argument). We can find it in the rdi register.
    Arch/ABI    Instruction           System  Ret  Ret  Error    Notes
    x86-64      syscall               rax     rax  rdx  -        5

    Arch/ABI      arg1  arg2  arg3  arg4  arg5  arg6  arg7  Notes
    x86-64        rdi   rsi   rdx   r10   r8    r9    -
Let’s script gdb. I want to see all calls to getenv including the parameter. commands 1 refers to the first breakpoint (set by break getenv). The set breakpoint pending on is important because when we set the breakpoint the getenv function is not resolved at this time.
kmille@linbox:cat .gdbinit
set breakpoint pending on
set pagination off

break getenv
commands 1
    x/s $rdi
    continue
end
run
The output of gdb looks like this:
kmille@linbox:debugging-urxvt gdb -q $(which urxvt)
Reading symbols from /usr/bin/urxvt...
(No debugging symbols found in /usr/bin/urxvt)
Function "getenv" not defined.
Breakpoint 1 (getenv) pending.
[Thread debugging using libthread_db enabled]
Using host libthread_db library "/usr/lib/libthread_db.so.1".

Breakpoint 1, __GI_getenv (name=0x7ffff7219210 "G_MESSAGES_PREFIXED") at getenv.c:34
34      getenv.c: No such file or directory.
0x7ffff7219210: "G_MESSAGES_PREFIXED"

Breakpoint 1, __GI_getenv (name=0x7ffff7219240 "G_DEBUG") at getenv.c:34
34      in getenv.c
0x7ffff7219240: "G_DEBUG"

Breakpoint 1, __GI_getenv (name=0x7ffff7222378 "G_SLICE") at getenv.c:34
In my case the urxvt terminal appears as normal. No problem/segfault so far. If I close urxvt, the segfault happens.
Breakpoint 1, __GI_getenv (name=name@entry=0x7ffff7a504d6 "PERL_DESTRUCT_LEVEL") at getenv.c:34
34      in getenv.c
0x7ffff7a504d6: "PERL_DESTRUCT_LEVEL"

Program received signal SIGSEGV, Segmentation fault.
__GI_getenv (name=0x7ffff7a504d8 "RL_DESTRUCT_LEVEL", name@entry=0x7ffff7a504d6 "PERL_DESTRUCT_LEVEL") at getenv.c:84
84      in getenv.c
(gdb)
In the end, I could prevent the segfault by starting urxvt with PERL_DESTRUCT_LEVEL=2 as environment variable.
kmille@linbox:~ urxvt
zsh: segmentation fault (core dumped)  urxvt
kmille@linbox:~ PERL_DESTRUCT_LEVEL=2 urxvt
kmille@linbox:~
The bug was already known. It was discussed here and here. I didn’t understood the underlying problem but I learned how to dig deeper. I will need it in the future so I made this document. I also proposed a patch in the Arch bug report.
Some useful things
- use
set style enabled offif you have redshift on - use
disas <function in which the segfault happens>and you will see the exact position (marked with => where the segfault happens) - use
directory <absolute path>in the gdbinit to tell gdb where the source code is- then use
gdb -tui
- then use
- use
gdb -qto hide the license message at the start of gdb - use
break basic.c:101to set a breakpoint in a dedicated file and line - use
jump +1to skip a line of c code (like an assert) - build software with
-ggdb3to get debug symbols - use
print argv[0]andptype argv - use
info locals,info args,info registers - use
x/gx(giant hex) to get the address of a variable - try out valgrind
valgrind --leak-check=full --show-leak-kinds=all --track-origins=yes --verbose --log-file=valgrind-out.txt urxvt
Resources
- http://www.brendangregg.com/blog/2016-08-09/gdb-example-ncurses.html
- https://jvns.ca/blog/2018/04/28/debugging-a-segfault-on-linux/
- https://wiki.archlinux.org/index.php/Core_dump
- https://wiki.archlinux.org/index.php/Debug_-_Getting_Traces
- https://wiki.archlinux.org/index.php/Debugging
- https://stackoverflow.com/questions/5134891/how-do-i-use-valgrind-to-find-memory-leaks
- GDB cheatsheet: https://gist.github.com/rkubik/b96c23bd8ed58333de37f2b8cd052c30
TODOS/IDEAS
- set conditional breakpoints
- use eBPF to trace all getenv calls
- the ltrace output was just empty. I expected to see calls to getenv
- use strace to debug segfaults
- learn to use
vcs