The fact that you see some plain text, but not all plain text, is the most confusing aspect of IPsec to system administrators, who now believe hey are leaking plain text.
The better you know how a system works the better you can debug it. So before debugging IPsec read this:
- https://wiki.strongswan.org/projects/strongswan/wiki/CorrectTrafficDump
- https://devcentral.f5.com/s/articles/understanding-ikev1-negotiation-on-wireshark-34187
Phase 1
- Firewall allows
udp port 500incoming? Outgoing traffic allowed? - Is there communication between the both IPsec gateways?
- Check it with
tcpdump -ni any host <remote host> - Are we sending packets to the remote endpoint?
- Is the remote endpoint talking to us?
- Are they both talking to each other? We had the problem: We speak IKEv1. They speak IKEv2. Our stack was too old to recognize IKEv2
- Check it with
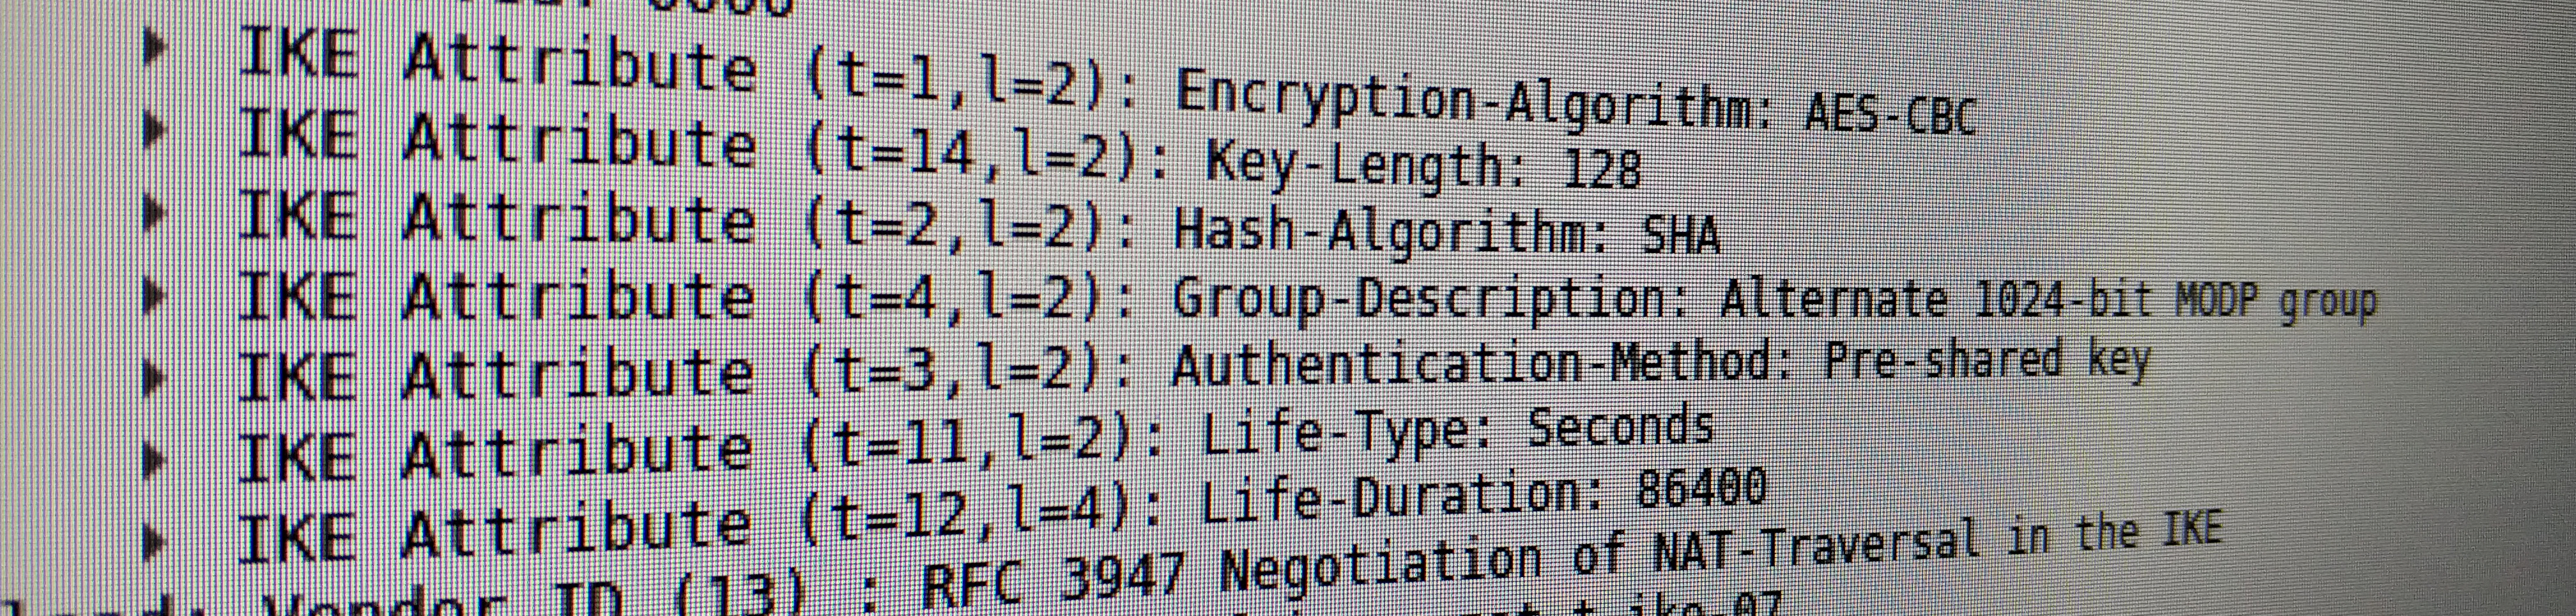
- Are both using the same proposals? You can use Wireshark to compare the parameters.
- Any errors in
tail -f /var/log/syslog? - Is the secret the same on both endpoints (prevent special characters on really old systems)?
- We had problems using sha2 (the generated keys for phase2 where truncated at the wrong length) - use sha1 or sha512
Do you think it works?
- check
racoocnctl show-sa esp(look for state=mature) - keep in mind: tunnel will only be established if there is some traffic
ping -I <src ip that goes through the the tunnel> <ip that goes through the tunnel>
Phase 2
Check if the tunnel works:
- You can ping a remote host? Great! Also check TCP in case of ugly NAT rules!
- You send packets through the tunnel but no esp packets are sent?
- Check it with
tcpdump -ni any host <remote ipsec endpoint>
- Check it with
- Firewall allows
esppackets in both directions? - Both endpoints have phase2 configured properly (ip ranges, crypto, …)?
- phase2 is encrypted. Wireshark is not that helpful here
- You read the logs carefully?
- You increased the debug level (
log notify, debug,and debug2)? - You verified with tcpdump that the traffic that should go into the tunnel looks like you expect?
- The firewall works as expected?
- Use
-j TRACE,-j NFLOGor-j LOGto see what iptables is trying to match - There is a rule in the FORWARD chain that allows the traffic? Rule is used?
- There is no rule in the
-t nat -L POSTROUTINGchain that NATs your traffic because of a rule like-t nat -A POSTROUTING -o wan_interface -j MASQUERDE? This would prevent it from going into the tunnel because source ip does not match anymore
- Use
- Is there someone else who can help you?
- You took a break after the first hour of debugging? It probably won’t get better!
- You yelled at IPsec and asked ‘Why not Wireguard’?
- You see traffic going into the tunnel but there is no response (only outgoing
esppackages)- problem lays on the other side (ping not allowed? Firewall drops packages?)
Debug commands
ip xfrm policyshows the established phase2 connectionsip xfrm stateshows the keys and bytes used for a phase2 connectionip xfrm policyshows changes
This packet flow overview can help you debugging issues:

TODOS
- It should be possible to decrypt the phase2 handshakes like described here by reading the debug2 output of racoon
Decrypt IPsec traffic
- Use this script to generate a esp_sa file
- the script puts the output of
ip xfrm statein a format wireshark likes
- the script puts the output of
- Put the file to the right place
scp server:esp_sa ~/.config/wireshark/esp_sa - Wireshark will automatically use the file. Use the Wireshark filter
!isakmp- check it manually: Wireshark -> Edit -> Preferences -> Protocols -> ESP -> ESP SAs